by Paul Goldman, Ph.D.
Sr. Research Scientist
Bently Rotor Dynamics Research Corporation
e-mail: paul.goldman@bently.com

and Agnes Muszynska, Ph.D.
Research Manager and
Sr. Research Scientist
Bently Rotor Dynamics Research Corporation
e-mail: agnes@bently.com
|
In 1993, Bently Nevada Corporation introduced the "full spectrum" plot, as contrasted to the "traditional (half) spectrum" plot, and pioneered its application to rotating machinery monitoring and diagnostics. Since then, full spectrum plots have been included in all major Bently Nevada machinery management software packages, such as ADRE® for Windows and Data Manager® 2000 for Windows NT. Several articles have been published in past Orbit magazines which explain the meaning and applications of full spectrum plots and their advantages over half spectrum plots [1-3]. Nevertheless, full spectrum plots remain unfamiliar to many Bently Nevada customers. The questions most often asked are:
- How is the full spectrum generated?
- What is the correlation of it with half spectrum and/or with filtered orbits?
- What can it do for me, and why do I have to bother learning about it?
|
Benefits of full spectrum plots
|
Before we answer these questions, we'd like to start with the following observation:
The objective of data processing is to extract and display the maximum amount of significant diagnostic information from the original signals generated by the transducers.
One of the pieces of information inadvertently hidden and ignored is the correlation between the vibration patterns from different transducers. The full spectrum plot displays the correlation between the vibration data from the X and Y components of the rotor or casing lateral response. At a glance, the full spectrum plot allows us to determine whether the rotor orbit or machine casing motion frequency components are forward or backward in relation to the direction of rotor rotation. This information, which is characteristic of specific machinery malfunctions, makes the full spectrum plot a powerful tool for interpreting the vibration signals of rotating machinery.
|
How the full spectrum is generated

Figure 1

Figure 2
|
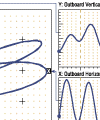
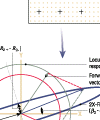
Figures 1 & 2 show the generation of the half and full spectrum plots.
The process of creating either full or half spectrum plots starts from digitizing the vibration waveforms. In the case of XY probes measuring rotor lateral vibration, there is one waveform from each channel. Combined, they generate a direct orbit. Note that the orbit represents the magnified path of the actual motion of the rotor centerline.
Half spectrums are independently calculated from each waveform (Figure 1). During this calculation, a part of the information contained in the waveform and orbit is not retained. In particular, the relative phase correlation between X spectrum and Y spectrum components is not displayed. Thus, filtered orbits cannot be reconstructed using corresponding frequency components from X and Y half spectrums. Also, the half spectrum information shows no relationship to the direction of the rotor rotation.
One process for obtaining a full spectrum, which demonstrates the correlation between the orbit and full spectrum, includes an expansion of the direct orbit into a sum of filtered orbits (Figure 2). Each filtered orbit has, in general, an elliptical shape. An elliptical orbit can be presented as a sum of two circular orbits: one is the locus of the vector rotating in the direction of rotation (forward), and the other is the locus of the vector rotating in the opposite direction (reverse). Both vectors rotate at the same frequency (the frequency of the filtered orbit).
|
What is the correlation of full spectrum with filtered orbits and half spectrum?
|
Since such a presentation of the filtered orbit can be done in only one way, forward and reverse circles are completely determined by the filtered orbit. An instantaneous position of the rotor on its filtered orbit can be presented as a sum of vectors of the instantaneous positions on the forward and reverse orbits:
Rw+
e
j(wt+ aw)
+Rw e j(wt+bw). Here Rw+ and R w are the radiuses of the forward and reverse orbits, w is the frequency of filtering, and aw and b w are phases of forward and reverse responses. In Figure 2, w = W. Since W is the rotative speed, w can, therefore, be equal to W or to 2W. (1X or 2X). Note that the major axis of the filtered orbit ellipse is Rw++Rw , while its minor axis is ÞRw+RwÞ. Forward precession of the filtered elliptical orbit (in the direction of the rotor rotation) means that Rw+>Rw , while reverse precession means that Rw+<Rw . To completely define an ellipse, the major axis orientation is needed. The angle between the horizontal probe and the ellipse major axis, (bw aw)/2, is determined by the relative phase of the forward and reverse components. In two important cases, the ellipse degenerates into a simpler form:
- If the filtered orbit is circular and forward, then the reverse component does not exist. If the filtered orbit is circular and reverse, then the forward component does not exist. There is no relative phase, and the major axis equals the minor axis.
- If the filtered orbit is a straight line, then the amplitude of the forward component is equal to the amplitude of the reverse component. Relative phase is still important to defining the orientation of the line.
A full spectrum is constructed from the radiuses of the forward and reverse components of the filtered orbits. The horizontal coordinate equals ± frequency (+ for the forward and - for the reverse components), and the vertical coordinate equals the peak to peak amplitude of the corresponding forward or reverse component.
|

Figure 3
|
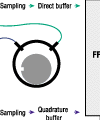
In ADRE® for Windows, the full spectrum is obtained as the result of an FFT transformation of the sampled signals. The X component is the direct input, and the Y component is the quadrature input (Figure 3). Half spectrums are obtained independently from X and Y sampled signals. Each of them is considered as the direct input to the FFT, while the quadrature input is zero.
It is important to note that the full spectrum forward and reverse component amplitudes can be used to recover the shape of the corresponding filtered orbit. Determining the orientation of the orbit is not possible in the full spectrum without the relative phase information, however. There is no way to make any judgment on the shape of the filtered orbit using half spectrums.
The full spectrum is unaffected by probe orientation or probe rotation, as is the orbit. The X and Y half spectrums are dependent on the actual probe locations and can change dramatically with changes in their orientation. These characteristics, along with the enhanced applications of the full spectrum, make it superior to the half spectrum.
|
What can it do for me?
|
So, now that we know how a full spectrum is created, and what additional information it contains in comparison to a half spectrum, the question is, "how can it be used?" In order to perform reliable diagnostics, all possible information has to be extracted from the available data. Since full spectrum contains more information than the half spectrum, it has an advantage from that perspective. It can be used for steady state analysis (full spectrum, full spectrum waterfall) or for transient analysis (full spectrum cascade).
One of the possible applications of full spectrum is for analysis of the rotor runout caused by mechanical, electrical, or magnetic irregularities. Depending on the periodicity of such irregularities observed by the XY proximity probes, different combinations of forward and reverse components are observed. The rules for such an analysis are summarized in Table 1. The amplitude and frequency components generated by the irregularities of the rotor do not change with rotative speed, unless there is a change in the rotor axial position. In that case, a new pattern will emerge, but it will follow the same rules.
Table 1. Runout signature analysis
| Periodicity of irregularities | Once per cycle | Twice per cycle | Three times per cycle | Four times per cycle | Five times per cycle |
Major
frequency
components | 1X forward (can include mechanical bow) | 2X forward and 2X reverse, with the same magnitudes | 3X reverse | 4X forward and 4X reverse, with the same magnitudes | 5X forward |
Information regarding the full spectrum content generated by some rotating machinery malfunctions is contained in Table 2.
Table 2. Rotating machinery malfunction as displayed by a full spectrum plot. The minus (-) means the components are nonexistent or, typically, of very small amplitude.
| Type of malfunction |
Frequency componentForward | Reverse | Comments |
| Unbalance | 1X | + | In presence of support stiffness anisotropy. |
Forward component is key for balancing. Reverse component can be reduced by the forward component reduction. |
| Unidirectional radial load | 1X | + | + | With the increase of the radial load, 1X and 2X forward components decrease, 1X and 2X reverse components increase; ellipticity of 1X and 2X orbits increases. |
| Rotor crack | 1X | + | - | Predominant change occurs in 1X and 2X forward component magnitudes. The reverse components could also exist due to the support stiffness anisotropy. They might also change due to the rotor crack. The 1X and 2X phases, particularly important to rotor crack diagnostics, are not displayed. |
| Partial rub | 1X | + | + |
1X and 2X components exhibit behavior similar to unidirectional radial load: increase in reverse and decrease in forward component amplitudes with increased rub severity. One thing to watch is filtered orbit major axis rotation. 1/2X, 1/3X, ... components appear if rotative speed is higher than, correspondingly, 2, 3, ... times the rub-modified rotor natural frequency. These subsynchronous frequencies have both forward and reverse components. The corresponding filtered orbits are highly elliptical, and the reverse components may be predominant. |
| 2X | + | + |
| 1/2X, 1/3X, ... | + | + |
| Full annular rub | Forced response | 1X | + | - | Depending on the dry friction between the rotor and the seal, seal susceptibility, damping, and unbalance, the system can exhibit either forced, predominantly 1X forward response, or self-excited, predominantly reverse response. |
| Self-excited response | Natural frequency of the coupled rotor-seal system | - | + |
| Fluid-induced whirl | lX
l=0.3 to 0.6 | + | - | Predominantly forward orbit with internal loops (a combination of whirl and 1X components). It is reflected in the full spectrum as forward subsynchronous component. |
| Fluid-induced whip | Rotor natural frequency excitation | + | + | Predominantly forward orbit with internal loops (a combination of whip and 1X components). It is reflected in the full spectrum as forward subsynchronous component.Usually some reverse 1X and subsynchronous components are present due to the bearing pedestal stiffness anisotropy. |
| Rotating stall | lXl=0.1 to 0.8 | + | - | Rotating stall can be differentiated from a fluid-induced instability by its disappearance with increased flow through the compressor. Full spectrum shows a picture very similar to that for a fluid-induced whirl. |
|
Conclusions
|
Table 2 is incomplete. Our knowledge of the application of full spectrum to rotating machinery monitoring and diagnostics is gradually evolving. However, even from what we know now, this new data presentation format is worth using. It allows assigning a direction to the rotor lateral response frequency analysis, and thus provides a better foundation for root cause analysis. Unlike individual half spectrums, full spectrum is independent of the particular orientation of probes. This independence, among other advantages, makes a comparison of different planes of lateral vibration measurements along the rotor train considerably easier.
|
References:
|
1. Southwick, D., "Using Full Spectrum Plots," Orbit, Vol. 14, No 4, December 1993, Bently Nevada Corporation.
2. Southwick, D., "Using Full Spectrum Plots Part 2," Orbit, Vol. 15, No 2, June 1994, Bently Nevada Corporation.
3. Laws, B., "When you use spectrum, don't use it halfway," Orbit, Vol. 18,
No 2, June 1998, Bently Nevada Corporation.
|


